Ctrl+K
Logo image Logo image
  • Plot-Typen
  • Beispiele
  • Tutorials
  • API-Referenz
  • Bedienungsanleitung
  • Beitragen
  • Plot types
  • Examples
  • Tutorials
  • Reference
  • User guide
  • Develop
  • Release notes

Section Navigation

  • Basic
    • Diagramm (x, y)
    • Streuung (x, y)
    • Balken(x, Höhe)
    • Stamm (x, y)
    • Schritt (x, y)
    • fill_between(x, y1, y2)
    • Stapelplot (x, y)
  • Diagramme von Arrays und Feldern
    • imshow(Z)
    • Farbnetz(X, Y, Z)
    • Kontur (X, Y, Z)
    • Konturf(X, Y, Z)
    • Widerhaken (X, Y, U, V)
    • Köcher (X, Y, U, V)
    • Streamplot (X, Y, U, V)
  • Statistik-Plots
    • hist(x)
    • Boxplot(X)
    • Fehlerbalken (x, y, yerr, xerr)
    • Violinplot(D)
    • Ereignisplot (D)
    • hist2d(x, y)
    • hexbin(x, y, C)
    • Kuchen (x)
  • Unstrukturierte Koordinaten
    • Dreikontur(x, y, z)
    • tricontourf(x, y, z)
    • tripcolor(x, y, z)
    • Triplot (x, y)

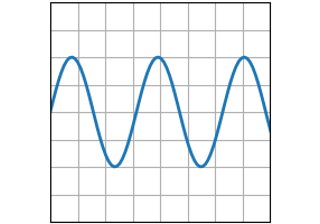
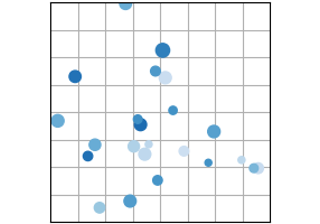
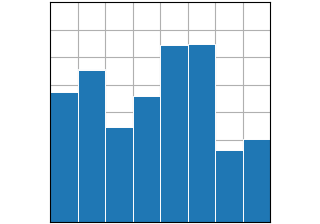
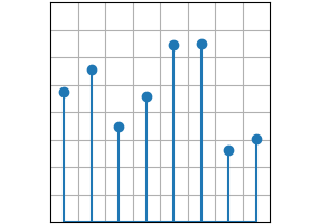
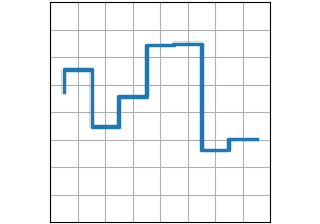
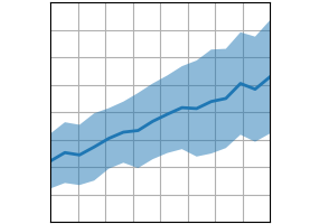
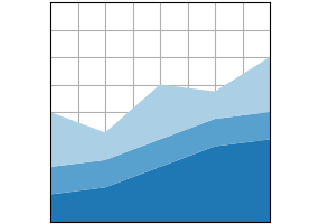
Einfach #

Grundlegende Diagrammtypen, normalerweise y gegen x.

Diagramm (x, y)

Diagramm (x, y)

Diagramm (x, y)
Streuung (x, y)

Streuung (x, y)

Streuung (x, y)
Balken(x, Höhe)

Balken(x, Höhe)

Balken(x, Höhe)
Stamm (x, y)

Stamm (x, y)

Stamm (x, y)
Schritt (x, y)

Schritt (x, y)

Schritt (x, y)
fill_between(x, y1, y2)

fill_between(x, y1, y2)

fill_between(x, y1, y2)
Stapelplot (x, y)

Stapelplot (x, y)

Stapelplot (x, y)
Quelle anzeigen

© Copyright 2002–2012 John Hunter, Darren Dale, Eric Firing, Michael Droettboom and the Matplotlib development team; 2012–2022 The Matplotlib development team.

Created using Sphinx 5.1.1.