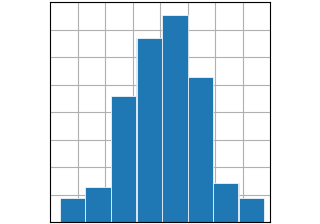
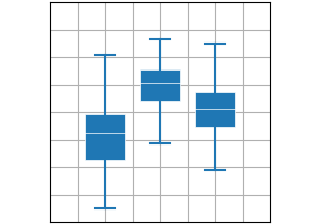
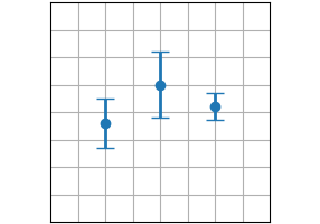
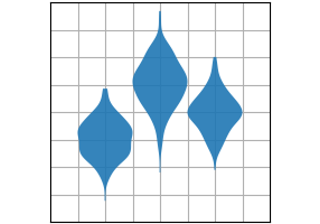
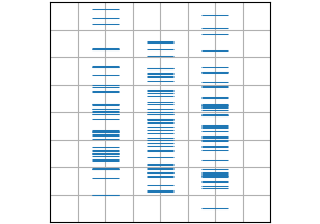
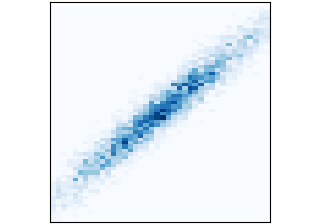
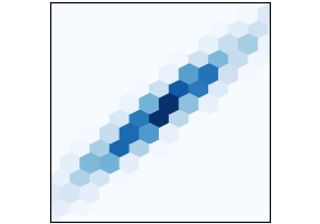
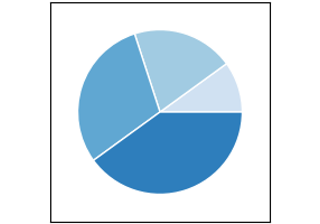
Statistik-Plots # Diagramme für die statistische Analyse. hist(x) hist(x) Boxplot(X) Boxplot(X) Fehlerbalken (x, y, yerr, xerr) Fehlerbalken (x, y, yerr, xerr) Violinplot(D) Violinplot(D) Ereignisplot (D) Ereignisplot (D) hist2d(x, y) hist2d(x, y) hexbin(x, y, C) hexbin(x, y, C) Kuchen (x) Kuchen (x)