Notiz
Klicken Sie hier , um den vollständigen Beispielcode herunterzuladen
Balken(x, Höhe) #
Siehe bar.
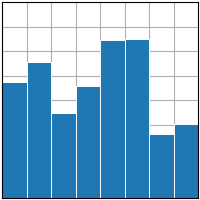
import matplotlib.pyplot as plt
import numpy as np
plt.style.use('_mpl-gallery')

# make data:
np.random.seed(3)
x = 0.5 + np.arange(8)
y = np.random.uniform(2, 7, len(x))

# plot
fig, ax = plt.subplots()

ax.bar(x, y, width=1, edgecolor="white", linewidth=0.7)

ax.set(xlim=(0, 8), xticks=np.arange(1, 8),
       ylim=(0, 8), yticks=np.arange(1, 8))

plt.show()