Notiz
Klicken Sie hier
, um den vollständigen Beispielcode herunterzuladen
plot(x, y)
Siehe plot.
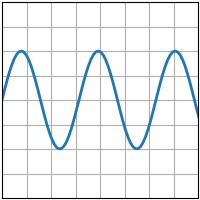
import matplotlib.pyplot as plt
import numpy as np

plt.style.use('_mpl-gallery')

# make data
x = np.linspace(0, 10, 100)
y = 4 + 2 * np.sin(2 * x)

# plot
fig, ax = plt.subplots()

ax.plot(x, y, linewidth=2.0)

ax.set(xlim=(0, 8), xticks=np.arange(1, 8),
       ylim=(0, 8), yticks=np.arange(1, 8))

plt.show()
Galerie generiert von Sphinx-Gallery