Notiz
Klicken Sie hier , um den vollständigen Beispielcode herunterzuladen
Das mplot3d-Toolkit #
Generieren von 3D-Diagrammen mit dem mplot3d-Toolkit.
Dieses Tutorial zeigt verschiedene 3D-Plots. Klicken Sie auf die Abbildungen, um jedes vollständige Galeriebeispiel mit dem Code anzuzeigen, der die Abbildungen generiert.
3D-Achsen (der Klasse Axes3D) werden erstellt, indem das projection="3d"
Schlüsselwortargument an übergeben wird Figure.add_subplot:
import matplotlib.pyplot as plt
fig = plt.figure()
ax = fig.add_subplot(projection='3d')
Mehrere 3D-Subplots können auf derselben Figur hinzugefügt werden, wie bei 2D-Subplots.
Geändert in Version 1.0.0: Vor Matplotlib 1.0.0 konnte nur eine Single Axes3Dpro Figur erstellt werden; es musste direkt als instanziiert werden .ax = Axes3D(fig)
Geändert in Version 3.2.0: Vor Matplotlib 3.2.0 war es notwendig, das
mpl_toolkits.mplot3dModul explizit zu importieren, um die 3D-Projektion in
Figure.add_subplot.
Weitere Informationen zum mplot3d-Toolkit finden Sie in den häufig gestellten Fragen zu mplot3d.
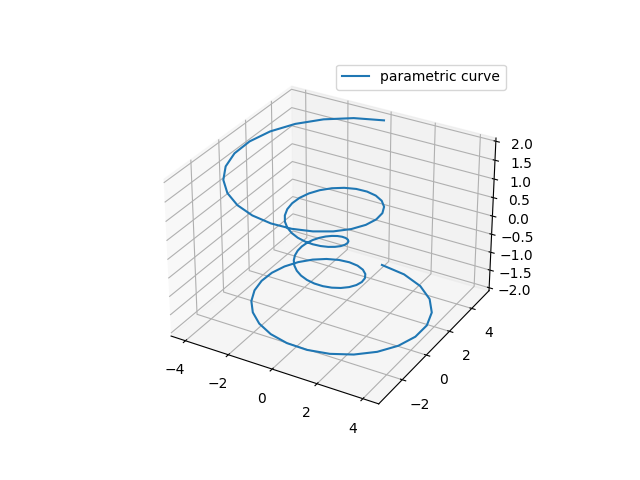
Liniendiagramme #
Siehe Axes3D.plotAPI-Dokumentation.
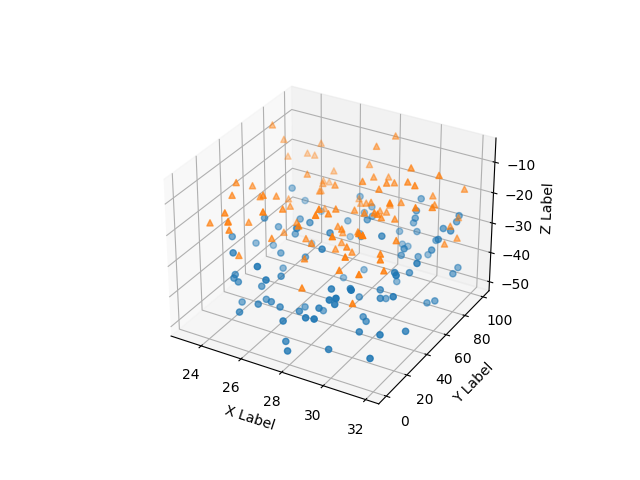
Streudiagramme #
Siehe Axes3D.scatterAPI-Dokumentation.
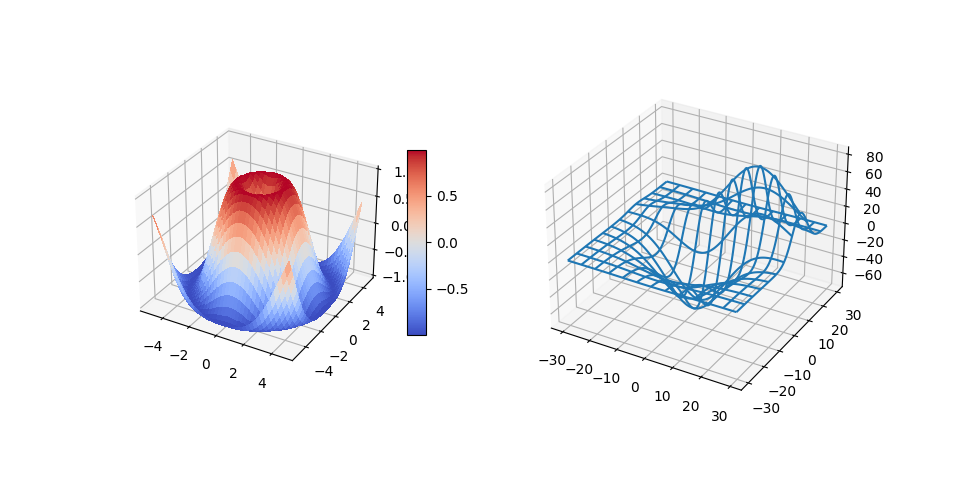
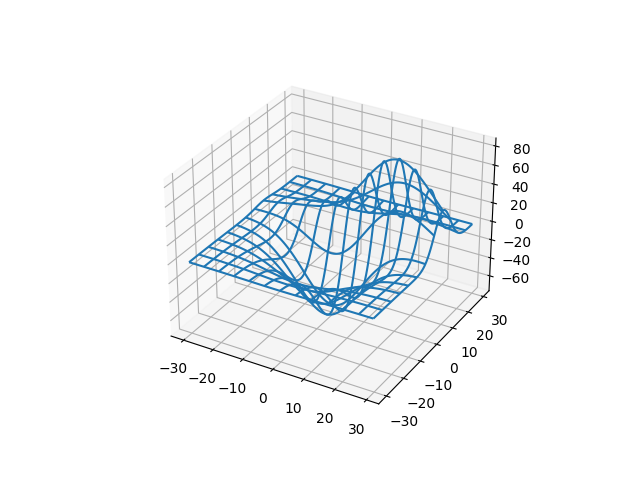
Drahtgitterdiagramme #
Siehe Axes3D.plot_wireframeAPI-Dokumentation.
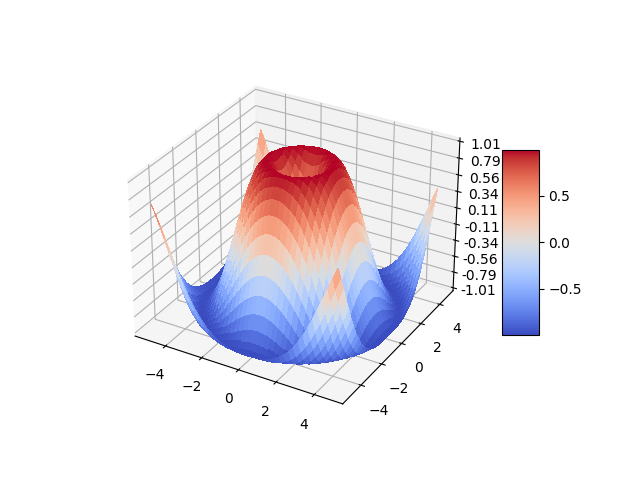
Oberflächenplots #
Siehe Axes3D.plot_surfaceAPI-Dokumentation.
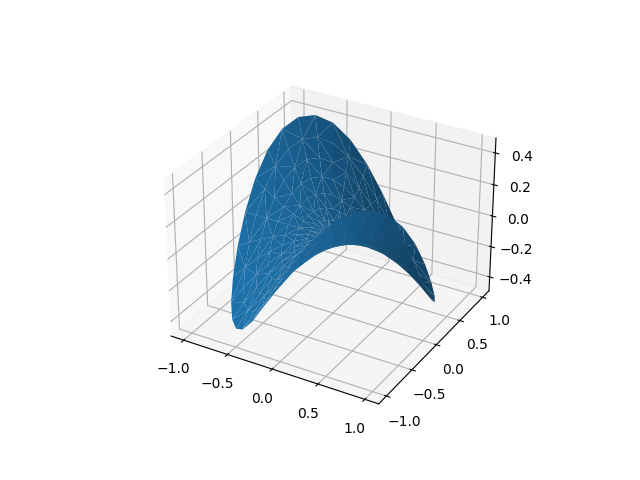
Tri-Surface-Plots #
Siehe Axes3D.plot_trisurfAPI-Dokumentation.
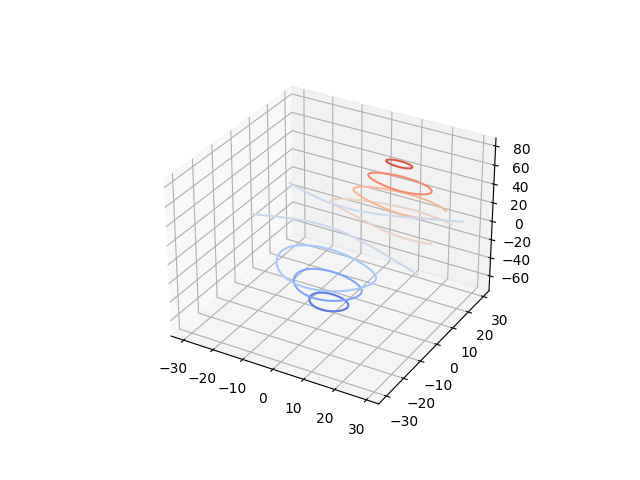
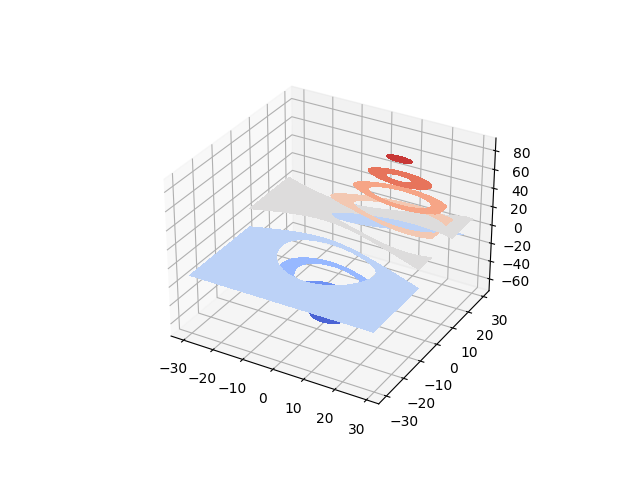
Konturdiagramme #
Siehe Axes3D.contourAPI-Dokumentation.
Gefüllte Konturdiagramme #
Siehe Axes3D.contourfAPI-Dokumentation.
Neu in Version 1.1.0: Die im zweiten contourf3d-Beispiel gezeigte Funktion wurde als Ergebnis eines Bugfixes für Version 1.1.0 aktiviert.
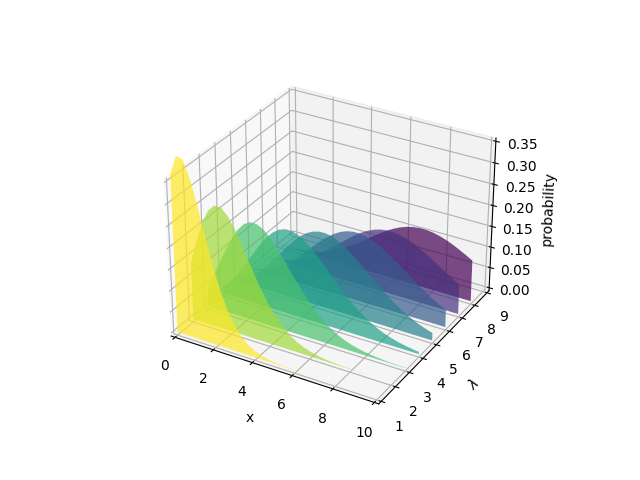
Polygondiagramme #
Siehe Axes3D.add_collection3dAPI-Dokumentation.
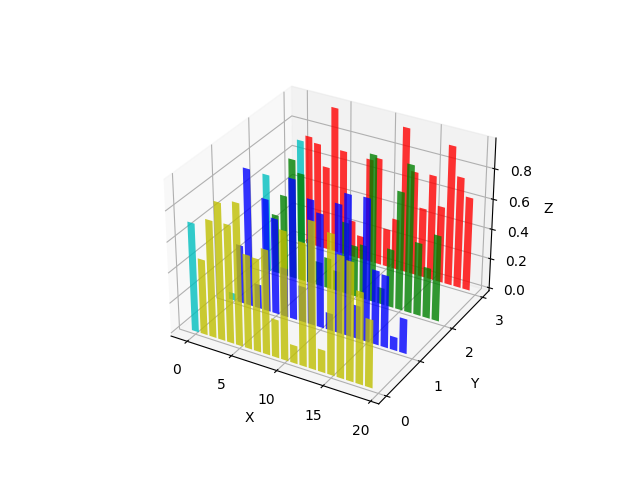
Balkendiagramme #
Siehe Axes3D.barAPI-Dokumentation.
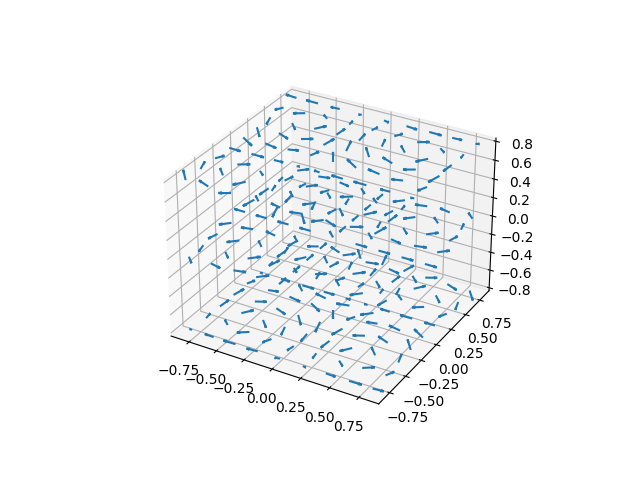
Köcher #
Siehe Axes3D.quiverAPI-Dokumentation.
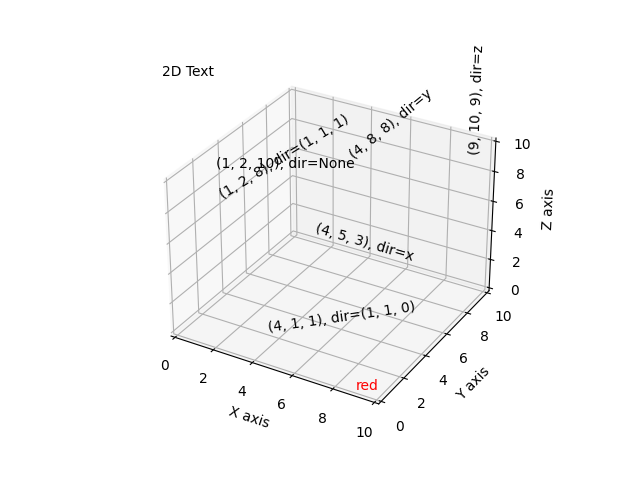
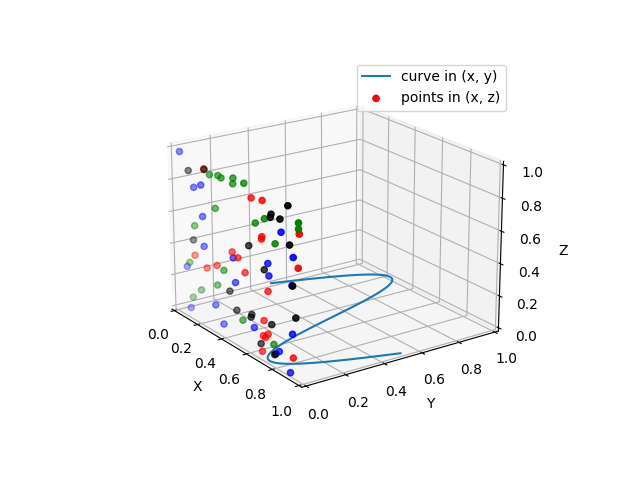
2D-Plots in 3D #
Text #
Siehe Axes3D.textAPI-Dokumentation.