Notiz
Klicken Sie hier , um den vollständigen Beispielcode herunterzuladen
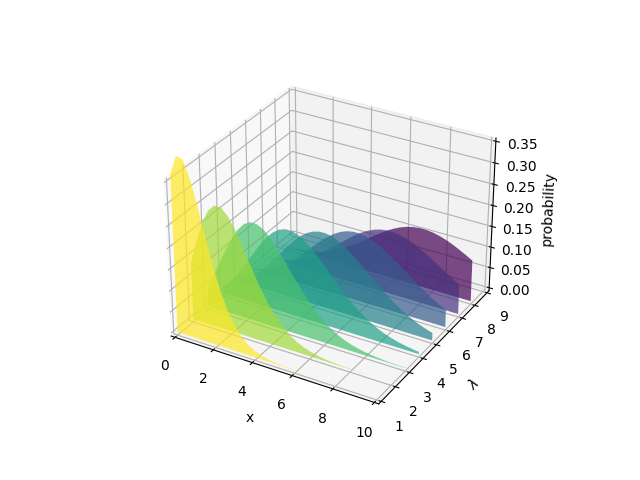
Generieren Sie Polygone zum Füllen unter dem 3D-Liniendiagramm #
Demonstrieren Sie, wie Polygone erstellt werden, die den Raum unter einem Liniendiagramm ausfüllen. In diesem Beispiel sind Polygone halbtransparent, wodurch eine Art „gezackter Buntglaseffekt“ entsteht.
from matplotlib.collections import PolyCollection
import matplotlib.pyplot as plt
import math
import numpy as np

# Fixing random state for reproducibility
np.random.seed(19680801)


def polygon_under_graph(x, y):
    """
    Construct the vertex list which defines the polygon filling the space under
    the (x, y) line graph. This assumes x is in ascending order.
    """
    return [(x[0], 0.), *zip(x, y), (x[-1], 0.)]


ax = plt.figure().add_subplot(projection='3d')

x = np.linspace(0., 10., 31)
lambdas = range(1, 9)

# verts[i] is a list of (x, y) pairs defining polygon i.
gamma = np.vectorize(math.gamma)
verts = [polygon_under_graph(x, l**x * np.exp(-l) / gamma(x + 1))
         for l in lambdas]
facecolors = plt.colormaps['viridis_r'](np.linspace(0, 1, len(verts)))

poly = PolyCollection(verts, facecolors=facecolors, alpha=.7)
ax.add_collection3d(poly, zs=lambdas, zdir='y')

ax.set(xlim=(0, 10), ylim=(1, 9), zlim=(0, 0.35),
       xlabel='x', ylabel=r'$\lambda$', zlabel='probability')

plt.show()