Notiz
Klicken Sie hier , um den vollständigen Beispielcode herunterzuladen
Streudiagramm mit Histogrammen #
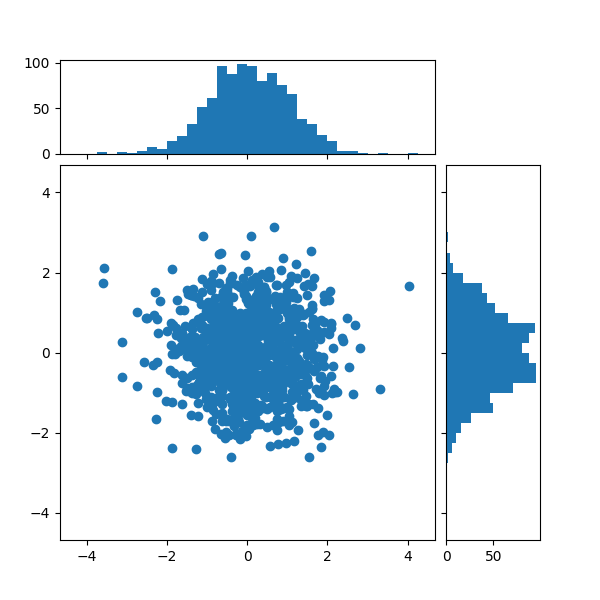
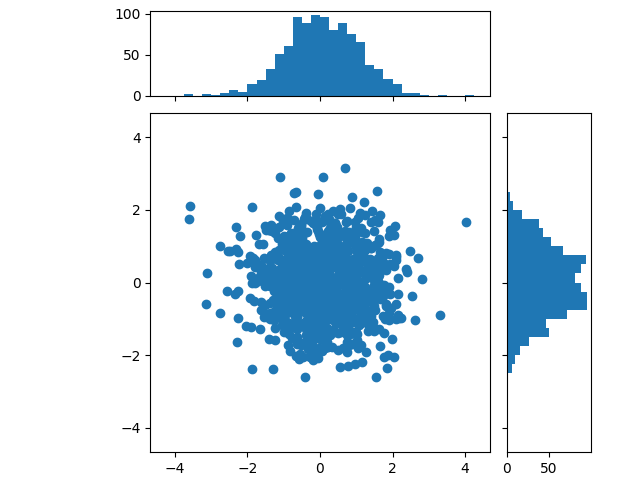
Zeigen Sie die Randverteilungen eines Streudiagramms als Histogramme an den Seiten des Diagramms an.
Für eine schöne Ausrichtung der Hauptachsen mit den Rändern werden unten zwei Optionen gezeigt:
Es ist zwar Axes.inset_axesetwas komplexer, ermöglicht aber die korrekte Handhabung von Hauptachsen mit festem Seitenverhältnis.
Eine alternative Methode zum Erstellen einer ähnlichen Figur mit dem axes_grid1
Toolkit wird im Beispiel für das Scatter-Histogramm (lokalisierbare Achsen) gezeigt
. Schließlich ist es auch möglich, mit Figure.add_axes(hier nicht dargestellt) alle Achsen in absoluten Koordinaten zu positionieren.
Lassen Sie uns zunächst eine Funktion definieren, die x- und y-Daten als Eingabe sowie drei Achsen, die Hauptachsen für die Streuung, und zwei Randachsen verwendet. Es erstellt dann das Streubild und die Histogramme innerhalb der bereitgestellten Achsen.
import numpy as np
import matplotlib.pyplot as plt

# Fixing random state for reproducibility
np.random.seed(19680801)

# some random data
x = np.random.randn(1000)
y = np.random.randn(1000)


def scatter_hist(x, y, ax, ax_histx, ax_histy):
    # no labels
    ax_histx.tick_params(axis="x", labelbottom=False)
    ax_histy.tick_params(axis="y", labelleft=False)

    # the scatter plot:
    ax.scatter(x, y)

    # now determine nice limits by hand:
    binwidth = 0.25
    xymax = max(np.max(np.abs(x)), np.max(np.abs(y)))
    lim = (int(xymax/binwidth) + 1) * binwidth

    bins = np.arange(-lim, lim + binwidth, binwidth)
    ax_histx.hist(x, bins=bins)
    ax_histy.hist(y, bins=bins, orientation='horizontal')
Definieren der Achsenpositionen mit einer Gridspec #
Wir definieren eine Rasterspezifikation mit ungleichen Breiten- und Höhenverhältnissen, um das gewünschte Layout zu erreichen. Siehe auch das Tutorial Mehrere Achsen in einer Figur anordnen .
# Start with a square Figure.
fig = plt.figure(figsize=(6, 6))
# Add a gridspec with two rows and two columns and a ratio of 1 to 4 between
# the size of the marginal axes and the main axes in both directions.
# Also adjust the subplot parameters for a square plot.
gs = fig.add_gridspec(2, 2,  width_ratios=(4, 1), height_ratios=(1, 4),
                      left=0.1, right=0.9, bottom=0.1, top=0.9,
                      wspace=0.05, hspace=0.05)
# Create the Axes.
ax = fig.add_subplot(gs[1, 0])
ax_histx = fig.add_subplot(gs[0, 0], sharex=ax)
ax_histy = fig.add_subplot(gs[1, 1], sharey=ax)
# Draw the scatter plot and marginals.
scatter_hist(x, y, ax, ax_histx, ax_histy)

Definieren der Achsenpositionen mit inset_axes #
inset_axeskann verwendet werden, um Ränder außerhalb der Hauptachsen zu positionieren. Dies hat den Vorteil, dass das Seitenverhältnis der Hauptachsen festgelegt werden kann und die Ränder immer relativ zur Position der Achsen gezeichnet werden.
# Create a Figure, which doesn't have to be square.
fig = plt.figure(constrained_layout=True)
# Create the main axes, leaving 25% of the figure space at the top and on the
# right to position marginals.
ax = fig.add_gridspec(top=0.75, right=0.75).subplots()
# The main axes' aspect can be fixed.
ax.set(aspect=1)
# Create marginal axes, which have 25% of the size of the main axes.  Note that
# the inset axes are positioned *outside* (on the right and the top) of the
# main axes, by specifying axes coordinates greater than 1.  Axes coordinates
# less than 0 would likewise specify positions on the left and the bottom of
# the main axes.
ax_histx = ax.inset_axes([0, 1.05, 1, 0.25], sharex=ax)
ax_histy = ax.inset_axes([1.05, 0, 0.25, 1], sharey=ax)
# Draw the scatter plot and marginals.
scatter_hist(x, y, ax, ax_histx, ax_histy)

plt.show()

Verweise
In diesem Beispiel wird die Verwendung der folgenden Funktionen, Methoden, Klassen und Module gezeigt:
Gesamtlaufzeit des Skripts: ( 0 Minuten 1.217 Sekunden)