Notiz
Klicken Sie hier , um den vollständigen Beispielcode herunterzuladen
TickedStroke-Pfadeffekt #
Matplotlibs patheffectskönnen verwendet werden, um die Art und Weise zu ändern, wie Pfade auf einer Ebene gezeichnet werden, die so niedrig ist, dass sie fast alles beeinflussen können.
Der Leitfaden zu Pfadeffekten beschreibt die Verwendung von Pfadeffekten.
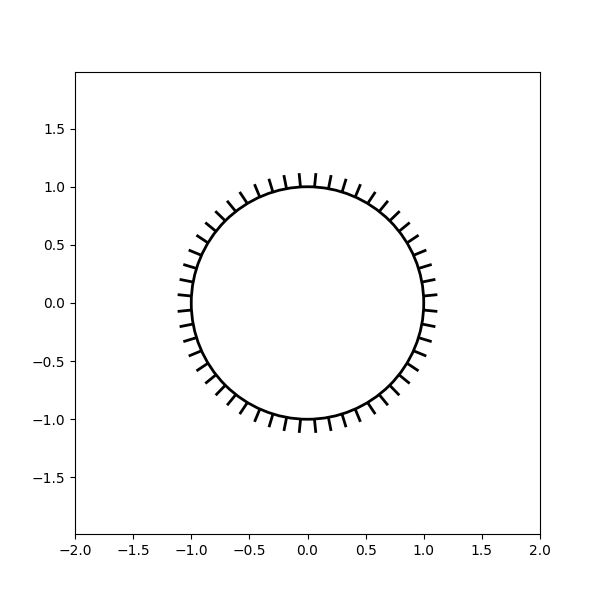
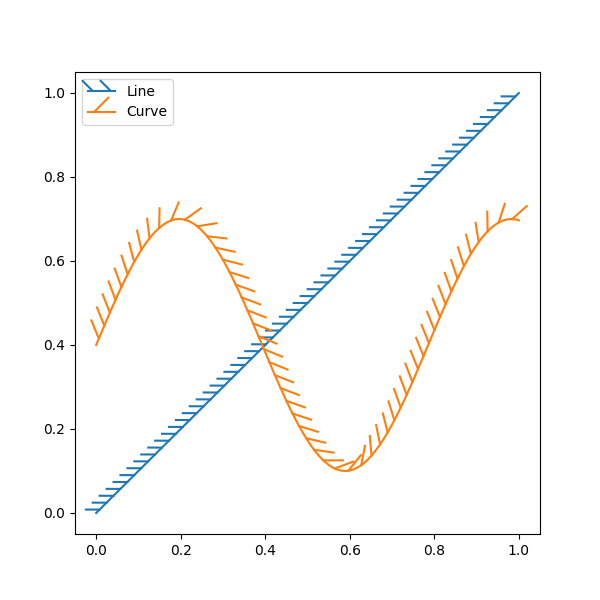
Der TickedStrokehier dargestellte Pfadeffekt zeichnet einen Pfad mit einem angekreuzten Stil. Der Abstand, die Länge und der Winkel der Ticks können gesteuert werden.
Siehe auch das Konturdemobeispiel .
Siehe auch die Konturen im Optimierungsbeispiel .
Anwenden von TickedStroke auf Pfade #
import matplotlib.patches as patches
from matplotlib.path import Path
import numpy as np
import matplotlib.pyplot as plt
import matplotlib.patheffects as patheffects

fig, ax = plt.subplots(figsize=(6, 6))
path = Path.unit_circle()
patch = patches.PathPatch(path, facecolor='none', lw=2, path_effects=[
    patheffects.withTickedStroke(angle=-90, spacing=10, length=1)])

ax.add_patch(patch)
ax.axis('equal')
ax.set_xlim(-2, 2)
ax.set_ylim(-2, 2)

plt.show()

Anwenden von TickedStroke auf Zeilen #
fig, ax = plt.subplots(figsize=(6, 6))
ax.plot([0, 1], [0, 1], label="Line",
        path_effects=[patheffects.withTickedStroke(spacing=7, angle=135)])

nx = 101
x = np.linspace(0.0, 1.0, nx)
y = 0.3*np.sin(x*8) + 0.4
ax.plot(x, y, label="Curve", path_effects=[patheffects.withTickedStroke()])

ax.legend()

plt.show()

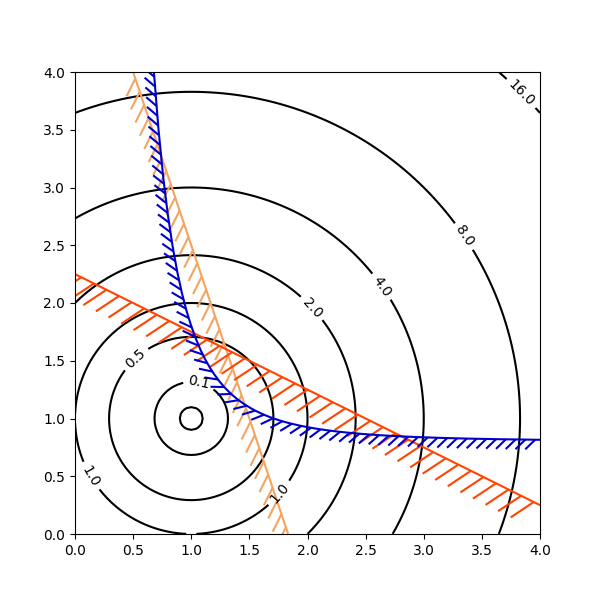
Anwenden von TickedStroke auf Konturdiagramme #
Konturdiagramm mit Ziel und Einschränkungen. Von der Kontur generierte Kurven zur Darstellung einer typischen Einschränkung in einem Optimierungsproblem sollten mit Winkeln zwischen null und 180 Grad gezeichnet werden.
fig, ax = plt.subplots(figsize=(6, 6))

nx = 101
ny = 105

# Set up survey vectors
xvec = np.linspace(0.001, 4.0, nx)
yvec = np.linspace(0.001, 4.0, ny)

# Set up survey matrices.  Design disk loading and gear ratio.
x1, x2 = np.meshgrid(xvec, yvec)

# Evaluate some stuff to plot
obj = x1**2 + x2**2 - 2*x1 - 2*x2 + 2
g1 = -(3*x1 + x2 - 5.5)
g2 = -(x1 + 2*x2 - 4.5)
g3 = 0.8 + x1**-3 - x2

cntr = ax.contour(x1, x2, obj, [0.01, 0.1, 0.5, 1, 2, 4, 8, 16],
                  colors='black')
ax.clabel(cntr, fmt="%2.1f", use_clabeltext=True)

cg1 = ax.contour(x1, x2, g1, [0], colors='sandybrown')
plt.setp(cg1.collections,
         path_effects=[patheffects.withTickedStroke(angle=135)])

cg2 = ax.contour(x1, x2, g2, [0], colors='orangered')
plt.setp(cg2.collections,
         path_effects=[patheffects.withTickedStroke(angle=60, length=2)])

cg3 = ax.contour(x1, x2, g3, [0], colors='mediumblue')
plt.setp(cg3.collections,
         path_effects=[patheffects.withTickedStroke(spacing=7)])

ax.set_xlim(0, 4)
ax.set_ylim(0, 4)

plt.show()

Gesamtlaufzeit des Skripts: ( 0 Minuten 1.492 Sekunden)