Notiz
Klicken Sie hier , um den vollständigen Beispielcode herunterzuladen
Streudiagramme mit einer Legende #
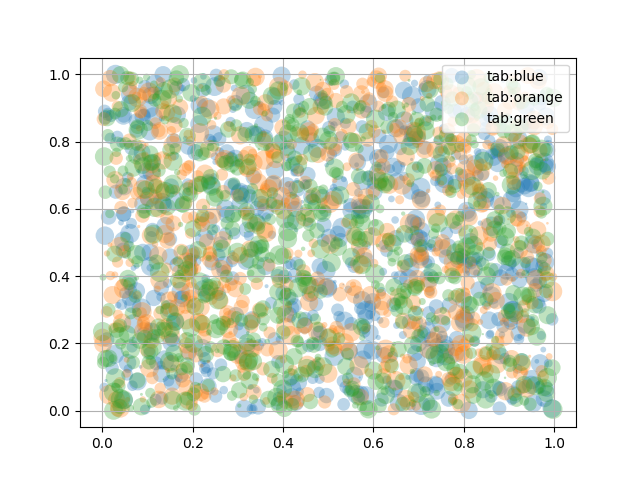
Um ein Streudiagramm mit einer Legende zu erstellen, kann man eine Schleife verwenden und ein
scatterDiagramm pro Element erstellen, das in der Legende erscheint, und das label
entsprechend einstellen.
Im Folgenden wird außerdem gezeigt, wie die Transparenz der Markierungen angepasst werden kann, indem alphaein Wert zwischen 0 und 1 angegeben wird.
import numpy as np
import matplotlib.pyplot as plt

np.random.seed(19680801)


fig, ax = plt.subplots()
for color in ['tab:blue', 'tab:orange', 'tab:green']:
    n = 750
    x, y = np.random.rand(2, n)
    scale = 200.0 * np.random.rand(n)
    ax.scatter(x, y, c=color, s=scale, label=color,
               alpha=0.3, edgecolors='none')

ax.legend()
ax.grid(True)

plt.show()

Automatisierte Legendenerstellung #
Eine weitere Möglichkeit, eine Legende für einen Scatter zu erstellen, ist die
PathCollection.legend_elementsMethode. Es wird automatisch versuchen, eine sinnvolle Anzahl anzuzeigender Legendeneinträge zu bestimmen und ein Tupel von Handles und Labels zurückzugeben. Die können zum Aufruf an weitergeleitet werden legend.
N = 45
x, y = np.random.rand(2, N)
c = np.random.randint(1, 5, size=N)
s = np.random.randint(10, 220, size=N)

fig, ax = plt.subplots()

scatter = ax.scatter(x, y, c=c, s=s)

# produce a legend with the unique colors from the scatter
legend1 = ax.legend(*scatter.legend_elements(),
                    loc="lower left", title="Classes")
ax.add_artist(legend1)

# produce a legend with a cross section of sizes from the scatter
handles, labels = scatter.legend_elements(prop="sizes", alpha=0.6)
legend2 = ax.legend(handles, labels, loc="upper right", title="Sizes")

plt.show()

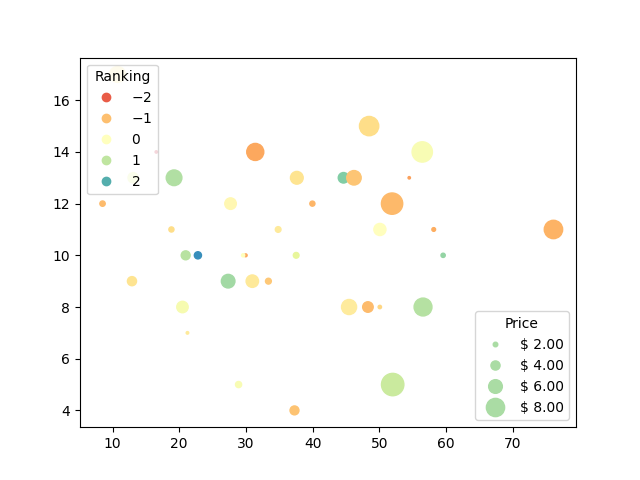
Über weitere Argumente der PathCollection.legend_elementsMethode kann gesteuert werden, wie viele Legendeneinträge erstellt und wie sie beschriftet werden sollen. Im Folgenden wird gezeigt, wie Sie einige davon verwenden.
volume = np.random.rayleigh(27, size=40)
amount = np.random.poisson(10, size=40)
ranking = np.random.normal(size=40)
price = np.random.uniform(1, 10, size=40)

fig, ax = plt.subplots()

# Because the price is much too small when being provided as size for ``s``,
# we normalize it to some useful point sizes, s=0.3*(price*3)**2
scatter = ax.scatter(volume, amount, c=ranking, s=0.3*(price*3)**2,
                     vmin=-3, vmax=3, cmap="Spectral")

# Produce a legend for the ranking (colors). Even though there are 40 different
# rankings, we only want to show 5 of them in the legend.
legend1 = ax.legend(*scatter.legend_elements(num=5),
                    loc="upper left", title="Ranking")
ax.add_artist(legend1)

# Produce a legend for the price (sizes). Because we want to show the prices
# in dollars, we use the *func* argument to supply the inverse of the function
# used to calculate the sizes from above. The *fmt* ensures to show the price
# in dollars. Note how we target at 5 elements here, but obtain only 4 in the
# created legend due to the automatic round prices that are chosen for us.
kw = dict(prop="sizes", num=5, color=scatter.cmap(0.7), fmt="$ {x:.2f}",
          func=lambda s: np.sqrt(s/.3)/3)
legend2 = ax.legend(*scatter.legend_elements(**kw),
                    loc="lower right", title="Price")

plt.show()

Verweise
In diesem Beispiel wird die Verwendung der folgenden Funktionen, Methoden, Klassen und Module gezeigt:
Gesamtlaufzeit des Skripts: ( 0 Minuten 1.840 Sekunden)