Notiz
Klicken Sie hier , um den vollständigen Beispielcode herunterzuladen
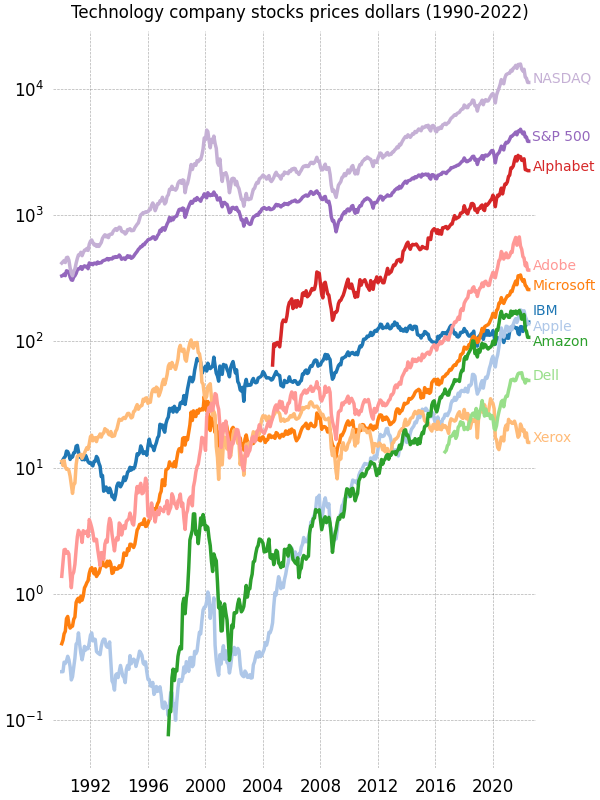
Aktienkurse über 32 Jahre #
Ein Diagramm mit mehreren Zeitreihen, das die benutzerdefinierte Gestaltung von Diagrammrahmen, Teilstrichlinien, Teilstrichbeschriftungen und Eigenschaften von Liniendiagrammen demonstriert. Es verwendet auch eine benutzerdefinierte Platzierung von Textbeschriftungen entlang der rechten Kante als Alternative zu einer herkömmlichen Legende.
Hinweis: Der mpl-Stil dufte eines Drittanbieters erzeugt ähnlich aussehende Plots mit weniger Code.
import numpy as np
import matplotlib.transforms as mtransforms
import matplotlib.pyplot as plt
from matplotlib.cbook import get_sample_data


def convertdate(x):
    return np.datetime64(x, 'D')


fname = get_sample_data('Stocks.csv', asfileobj=False)
stock_data = np.genfromtxt(fname, encoding='utf-8', delimiter=',',
                           names=True, dtype=None, converters={0: convertdate},
                           skip_header=1)


fig, ax = plt.subplots(1, 1, figsize=(6, 8), layout='constrained')

# These are the colors that will be used in the plot
ax.set_prop_cycle(color=[
    '#1f77b4', '#aec7e8', '#ff7f0e', '#ffbb78', '#2ca02c', '#98df8a',
    '#d62728', '#ff9896', '#9467bd', '#c5b0d5', '#8c564b', '#c49c94',
    '#e377c2', '#f7b6d2', '#7f7f7f', '#c7c7c7', '#bcbd22', '#dbdb8d',
    '#17becf', '#9edae5'])

stocks_name = ['IBM', 'Apple', 'Microsoft', 'Xerox', 'Amazon', 'Dell',
               'Alphabet', 'Adobe', 'S&P 500', 'NASDAQ']
stocks_ticker = ['IBM', 'AAPL', 'MSFT', 'XRX', 'AMZN', 'DELL', 'GOOGL',
                 'ADBE', 'GSPC', 'IXIC']

# Manually adjust the label positions vertically (units are points = 1/72 inch)
y_offsets = {k: 0 for k in stocks_ticker}
y_offsets['IBM'] = 5
y_offsets['AAPL'] = -5
y_offsets['AMZN'] = -6

for nn, column in enumerate(stocks_ticker):
    # Plot each line separately with its own color.
    # don't include any data with NaN.
    good = np.nonzero(np.isfinite(stock_data[column]))
    line, = ax.plot(stock_data['Date'][good], stock_data[column][good], lw=2.5)

    # Add a text label to the right end of every line. Most of the code below
    # is adding specific offsets y position because some labels overlapped.
    y_pos = stock_data[column][-1]

    # Use an offset transform, in points, for any text that needs to be nudged
    # up or down.
    offset = y_offsets[column] / 72
    trans = mtransforms.ScaledTranslation(0, offset, fig.dpi_scale_trans)
    trans = ax.transData + trans

    # Again, make sure that all labels are large enough to be easily read
    # by the viewer.
    ax.text(np.datetime64('2022-10-01'), y_pos, stocks_name[nn],
            color=line.get_color(), transform=trans)

ax.set_xlim(np.datetime64('1989-06-01'), np.datetime64('2023-01-01'))

fig.suptitle("Technology company stocks prices dollars (1990-2022)",
             ha="center")

# Remove the plot frame lines. They are unnecessary here.
ax.spines[:].set_visible(False)

# Ensure that the axis ticks only show up on the bottom and left of the plot.
# Ticks on the right and top of the plot are generally unnecessary.
ax.xaxis.tick_bottom()
ax.yaxis.tick_left()
ax.set_yscale('log')

# Provide tick lines across the plot to help your viewers trace along
# the axis ticks. Make sure that the lines are light and small so they
# don't obscure the primary data lines.
ax.grid(True, 'major', 'both', ls='--', lw=.5, c='k', alpha=.3)

# Remove the tick marks; they are unnecessary with the tick lines we just
# plotted. Make sure your axis ticks are large enough to be easily read.
# You don't want your viewers squinting to read your plot.
ax.tick_params(axis='both', which='both', labelsize='large',
               bottom=False, top=False, labelbottom=True,
               left=False, right=False, labelleft=True)

# Finally, save the figure as a PNG.
# You can also save it as a PDF, JPEG, etc.
# Just change the file extension in this call.
# fig.savefig('stock-prices.png', bbox_inches='tight')
plt.show()

Verweise
In diesem Beispiel wird die Verwendung der folgenden Funktionen, Methoden, Klassen und Module gezeigt:
Gesamtlaufzeit des Skripts: ( 0 Minuten 1.548 Sekunden)