Notiz
Klicken Sie hier , um den vollständigen Beispielcode herunterzuladen
Beschriften Sie Simple01 #
import matplotlib.pyplot as plt
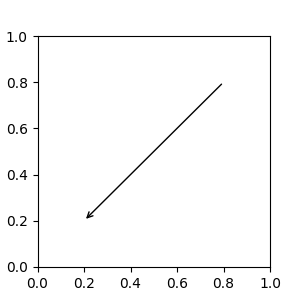
fig, ax = plt.subplots(figsize=(3, 3))
ax.annotate("",
xy=(0.2, 0.2), xycoords='data',
xytext=(0.8, 0.8), textcoords='data',
arrowprops=dict(arrowstyle="->",
connectionstyle="arc3"),
)
plt.show()