Notiz
Klicken Sie hier , um den vollständigen Beispielcode herunterzuladen
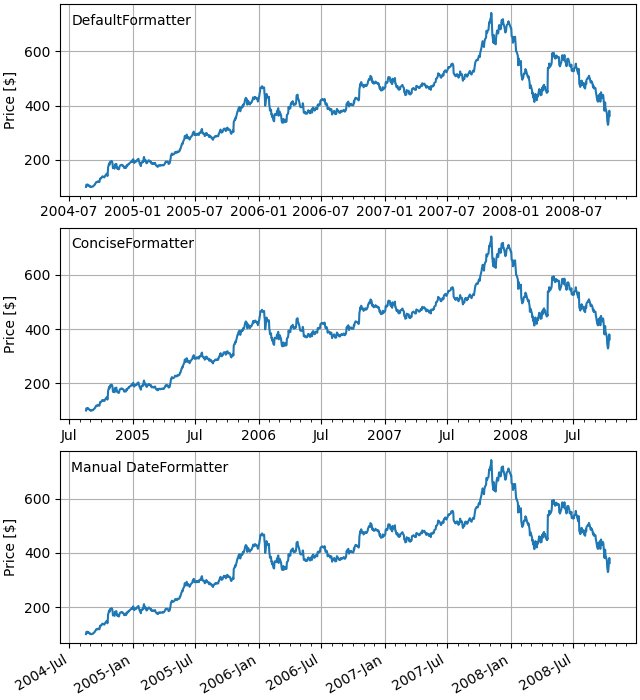
Datumsmarkierungen #
Die Matplotlib-Datumsdarstellung erfolgt durch Konvertieren von Datumsinstanzen in Tage seit einer Epoche (standardmäßig 1970-01-01T00:00:00). Das
matplotlib.datesModul stellt die Konverterfunktionen bereit date2num
und num2datekonvertiert datetime.datetimeund numpy.datetime64
Objekte in und aus der internen Darstellung von Matplotlib. Diese Datentypen werden mit dem in beschriebenen Einheitenkonvertierungsmechanismus registriert
matplotlib.units, sodass die Konvertierung für den Benutzer automatisch erfolgt. Der Registrierungsprozess legt auch das Standard-Tick locatorund
formatterfür die Achse auf AutoDateLocatorund
fest AutoDateFormatter.
Ein alternativer Formatierer ist der ConciseDateFormatter, der im zweiten Axesunten verwendet wird (siehe
Datumsmarkierungen mit ConciseDateFormatter formatieren ), wodurch häufig die Notwendigkeit entfällt, die Markierungsmarkierungen zu drehen. Der letzte Axesformatiert die Datumsangaben manuell, indem
DateFormatterer verwendet, um die Datumsangaben mit den unter dokumentierten Formatzeichenfolgen zu formatieren datetime.date.strftime.
import matplotlib.pyplot as plt
import matplotlib.dates as mdates
import matplotlib.cbook as cbook

# Load a numpy record array from yahoo csv data with fields date, open, high,
# low, close, volume, adj_close from the mpl-data/sample_data directory. The
# record array stores the date as an np.datetime64 with a day unit ('D') in
# the date column.
data = cbook.get_sample_data('goog.npz', np_load=True)['price_data']

fig, axs = plt.subplots(3, 1, figsize=(6.4, 7), constrained_layout=True)
# common to all three:
for ax in axs:
    ax.plot('date', 'adj_close', data=data)
    # Major ticks every half year, minor ticks every month,
    ax.xaxis.set_major_locator(mdates.MonthLocator(bymonth=(1, 7)))
    ax.xaxis.set_minor_locator(mdates.MonthLocator())
    ax.grid(True)
    ax.set_ylabel(r'Price [\$]')

# different formats:
ax = axs[0]
ax.set_title('DefaultFormatter', loc='left', y=0.85, x=0.02, fontsize='medium')

ax = axs[1]
ax.set_title('ConciseFormatter', loc='left', y=0.85, x=0.02, fontsize='medium')
ax.xaxis.set_major_formatter(
    mdates.ConciseDateFormatter(ax.xaxis.get_major_locator()))

ax = axs[2]
ax.set_title('Manual DateFormatter', loc='left', y=0.85, x=0.02,
             fontsize='medium')
# Text in the x axis will be displayed in 'YYYY-mm' format.
ax.xaxis.set_major_formatter(mdates.DateFormatter('%Y-%b'))
# Rotates and right-aligns the x labels so they don't crowd each other.
for label in ax.get_xticklabels(which='major'):
    label.set(rotation=30, horizontalalignment='right')

plt.show()
Gesamtlaufzeit des Skripts: ( 0 Minuten 1.408 Sekunden)