Notiz
Klicken Sie hier , um den vollständigen Beispielcode herunterzuladen
Geografische Projektionen #
Dies zeigt 4 mögliche geografische Projektionen. Cartopy unterstützt mehr Projektionen.
import matplotlib.pyplot as plt
plt.figure()
plt.subplot(projection="aitoff")
plt.title("Aitoff")
plt.grid(True)

plt.figure()
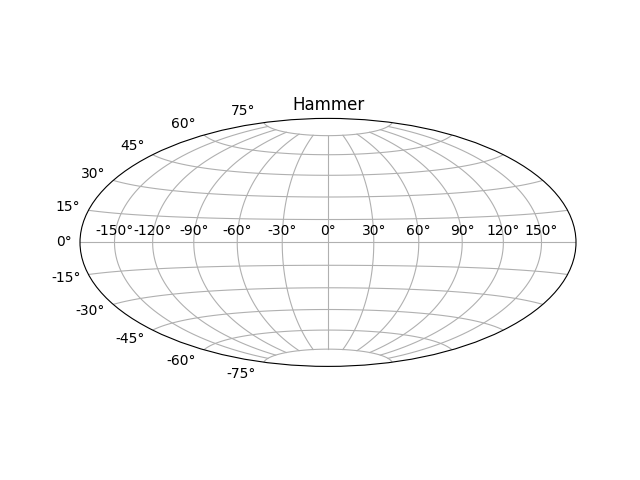
plt.subplot(projection="hammer")
plt.title("Hammer")
plt.grid(True)
plt.figure()
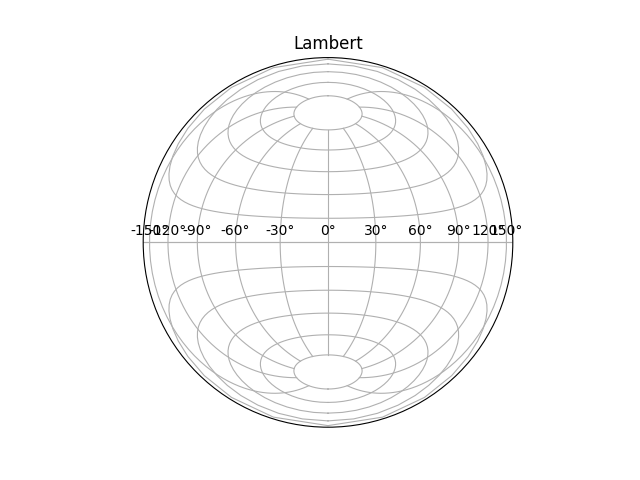
plt.subplot(projection="lambert")
plt.title("Lambert")
plt.grid(True)
plt.figure()
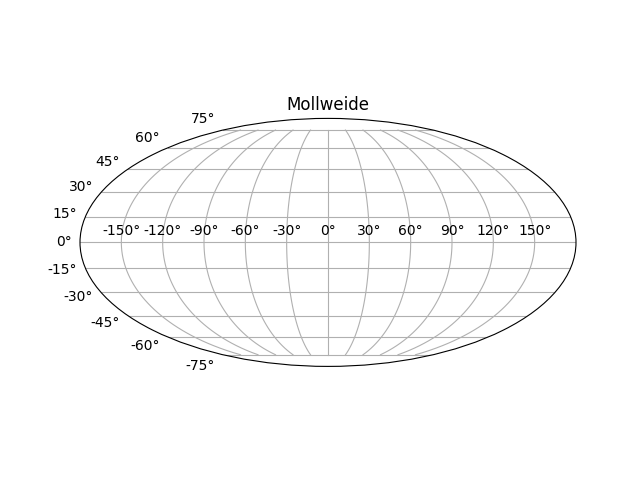
plt.subplot(projection="mollweide")
plt.title("Mollweide")
plt.grid(True)
plt.show()
Gesamtlaufzeit des Skripts: ( 0 Minuten 1.707 Sekunden)