Notiz
Klicken Sie hier , um den vollständigen Beispielcode herunterzuladen
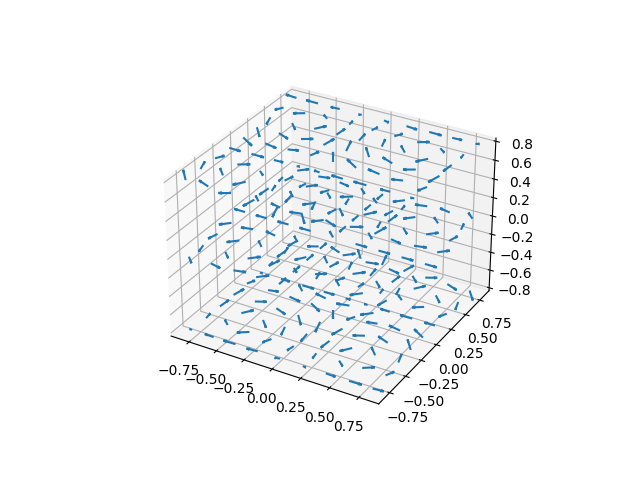
3D-Köcherplot #
Demonstriert das Plotten von Richtungspfeilen an Punkten auf einem 3D-Maschengitter.
import matplotlib.pyplot as plt
import numpy as np

ax = plt.figure().add_subplot(projection='3d')

# Make the grid
x, y, z = np.meshgrid(np.arange(-0.8, 1, 0.2),
                      np.arange(-0.8, 1, 0.2),
                      np.arange(-0.8, 1, 0.8))

# Make the direction data for the arrows
u = np.sin(np.pi * x) * np.cos(np.pi * y) * np.cos(np.pi * z)
v = -np.cos(np.pi * x) * np.sin(np.pi * y) * np.cos(np.pi * z)
w = (np.sqrt(2.0 / 3.0) * np.cos(np.pi * x) * np.cos(np.pi * y) *
     np.sin(np.pi * z))

ax.quiver(x, y, z, u, v, w, length=0.1, normalize=True)

plt.show()