Notiz
Klicken Sie hier , um den vollständigen Beispielcode herunterzuladen
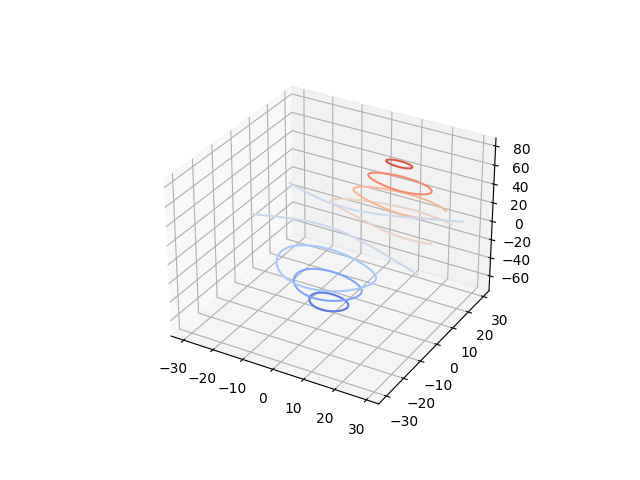
Demonstriert das Plotten von Konturkurven (Niveaukurven) in 3D #
Dies ist wie ein Konturdiagramm in 2D, außer dass die Kurve auf der Ebene gezeichnet wird .f(x, y)=cz=c
from mpl_toolkits.mplot3d import axes3d
import matplotlib.pyplot as plt
from matplotlib import cm

ax = plt.figure().add_subplot(projection='3d')
X, Y, Z = axes3d.get_test_data(0.05)

ax.contour(X, Y, Z, cmap=cm.coolwarm)  # Plot contour curves

plt.show()