Notiz
Klicken Sie hier , um den vollständigen Beispielcode herunterzuladen
pcolormesh #
axes.Axes.pcolormeshkönnen Sie 2D-Plots im Bildstil erstellen. Beachten Sie, dass es schneller ist als das ähnliche pcolor.
import matplotlib.pyplot as plt
from matplotlib.colors import BoundaryNorm
from matplotlib.ticker import MaxNLocator
import numpy as np
Einfaches pcolormesh #
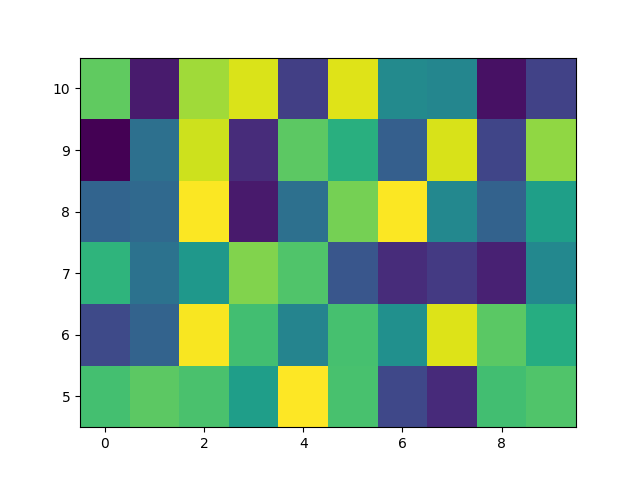
Normalerweise spezifizieren wir ein pcolormesh, indem wir die Kante von Vierecken und den Wert des Vierecks definieren. Beachten Sie, dass hier x und y jeweils ein zusätzliches Element als Z in der jeweiligen Dimension haben.
np.random.seed(19680801)
Z = np.random.rand(6, 10)
x = np.arange(-0.5, 10, 1)  # len = 11
y = np.arange(4.5, 11, 1)  # len = 7

fig, ax = plt.subplots()
ax.pcolormesh(x, y, Z)

<matplotlib.collections.QuadMesh object at 0x7f2d00aaeef0>
Nicht-geradliniges pcolormesh #
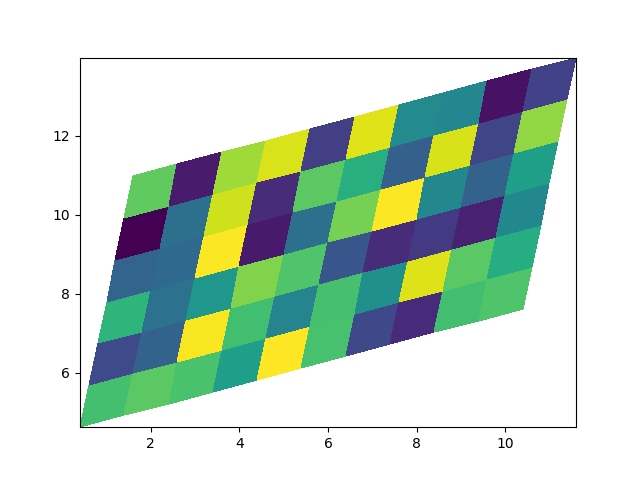
Beachten Sie, dass wir auch Matrizen für X und Y angeben können und nicht geradlinige Vierecke haben.

<matplotlib.collections.QuadMesh object at 0x7f2d00c610f0>
Zentrierte Koordinaten #
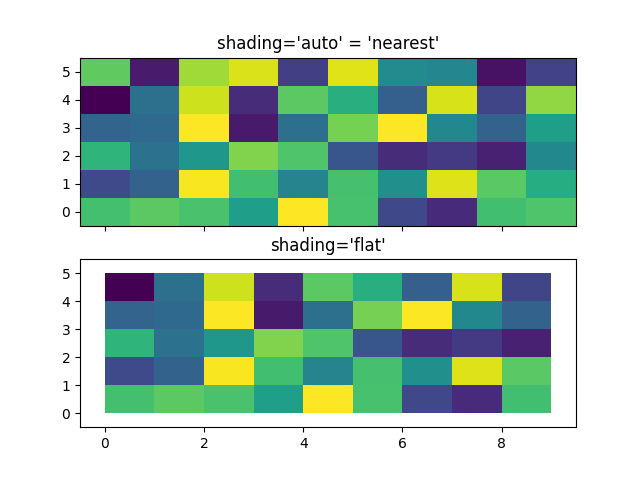
Häufig möchte ein Benutzer X und Y mit denselben Größen wie Z an
übergeben axes.Axes.pcolormesh. Dies ist auch erlaubt, wenn shading='auto'übergeben wird (Standardeinstellung durch rcParams["pcolor.shading"](default: 'auto')). Pre Matplotlib 3.3
shading='flat'würde die letzte Spalte und Zeile von Z löschen ; Während dies aus Gründen der Abwärtskompatibilität weiterhin zulässig ist, wird eine DeprecationWarning ausgelöst. Wenn Sie das wirklich wollen, löschen Sie einfach die letzte Zeile und Spalte von Z manuell:
x = np.arange(10)  # len = 10
y = np.arange(6)  # len = 6
X, Y = np.meshgrid(x, y)

fig, axs = plt.subplots(2, 1, sharex=True, sharey=True)
axs[0].pcolormesh(X, Y, Z, vmin=np.min(Z), vmax=np.max(Z), shading='auto')
axs[0].set_title("shading='auto' = 'nearest'")
axs[1].pcolormesh(X, Y, Z[:-1, :-1], vmin=np.min(Z), vmax=np.max(Z),
                  shading='flat')
axs[1].set_title("shading='flat'")

Text(0.5, 1.0, "shading='flat'")
Erstellen von Levels mit Normen #
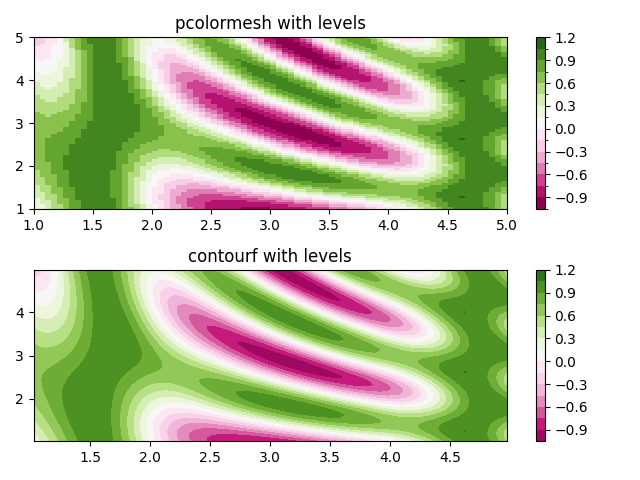
Zeigt, wie Normalisierungs- und Colormap-Instanzen kombiniert werden, um "Ebenen" in zu zeichnen axes.Axes.pcolor, axes.Axes.pcolormesh
und axes.Axes.imshowPlots auf ähnliche Weise wie das Schlüsselwort-Argument "levels" für contour/contourf einzugeben.
# make these smaller to increase the resolution
dx, dy = 0.05, 0.05

# generate 2 2d grids for the x & y bounds
y, x = np.mgrid[slice(1, 5 + dy, dy),
                slice(1, 5 + dx, dx)]

z = np.sin(x)**10 + np.cos(10 + y*x) * np.cos(x)

# x and y are bounds, so z should be the value *inside* those bounds.
# Therefore, remove the last value from the z array.
z = z[:-1, :-1]
levels = MaxNLocator(nbins=15).tick_values(z.min(), z.max())


# pick the desired colormap, sensible levels, and define a normalization
# instance which takes data values and translates those into levels.
cmap = plt.colormaps['PiYG']
norm = BoundaryNorm(levels, ncolors=cmap.N, clip=True)

fig, (ax0, ax1) = plt.subplots(nrows=2)

im = ax0.pcolormesh(x, y, z, cmap=cmap, norm=norm)
fig.colorbar(im, ax=ax0)
ax0.set_title('pcolormesh with levels')


# contours are *point* based plots, so convert our bound into point
# centers
cf = ax1.contourf(x[:-1, :-1] + dx/2.,
                  y[:-1, :-1] + dy/2., z, levels=levels,
                  cmap=cmap)
fig.colorbar(cf, ax=ax1)
ax1.set_title('contourf with levels')

# adjust spacing between subplots so `ax1` title and `ax0` tick labels
# don't overlap
fig.tight_layout()

plt.show()

Verweise
In diesem Beispiel wird die Verwendung der folgenden Funktionen, Methoden, Klassen und Module gezeigt:
Gesamtlaufzeit des Skripts: ( 0 Minuten 1.467 Sekunden)