Notiz
Klicken Sie hier , um den vollständigen Beispielcode herunterzuladen
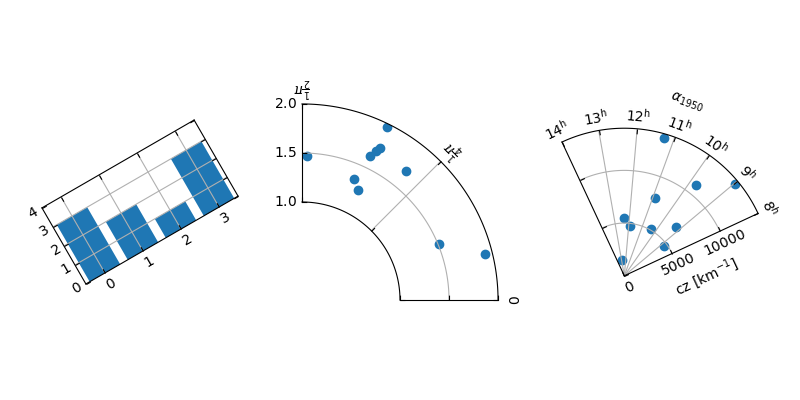
mpl_toolkits.axisartist.floating_axesFunktionen #
Demonstration der Funktionen des floating_axesModuls:
Verwenden
GridHelperCurveLinearSie , um das Diagramm zu drehen und die Diagrammgrenze festzulegen.Using
FloatingSubplotzum Erstellen eines Subplots unter Verwendung des Rückgabewerts vonGridHelperCurveLinear.Erstellen eines Sektorplots durch Hinzufügen weiterer Funktionen zu
GridHelperCurveLinear.
from matplotlib.transforms import Affine2D
import mpl_toolkits.axisartist.floating_axes as floating_axes
import numpy as np
import mpl_toolkits.axisartist.angle_helper as angle_helper
from matplotlib.projections import PolarAxes
from mpl_toolkits.axisartist.grid_finder import (FixedLocator, MaxNLocator,
                                                 DictFormatter)
import matplotlib.pyplot as plt

# Fixing random state for reproducibility
np.random.seed(19680801)


def setup_axes1(fig, rect):
    """
    A simple one.
    """
    tr = Affine2D().scale(2, 1).rotate_deg(30)

    grid_helper = floating_axes.GridHelperCurveLinear(
        tr, extremes=(-0.5, 3.5, 0, 4),
        grid_locator1=MaxNLocator(nbins=4),
        grid_locator2=MaxNLocator(nbins=4))

    ax1 = fig.add_subplot(
        rect, axes_class=floating_axes.FloatingAxes, grid_helper=grid_helper)
    ax1.grid()

    aux_ax = ax1.get_aux_axes(tr)

    return ax1, aux_ax


def setup_axes2(fig, rect):
    """
    With custom locator and formatter.
    Note that the extreme values are swapped.
    """
    tr = PolarAxes.PolarTransform()

    pi = np.pi
    angle_ticks = [(0, r"$0$"),
                   (.25*pi, r"$\frac{1}{4}\pi$"),
                   (.5*pi, r"$\frac{1}{2}\pi$")]
    grid_locator1 = FixedLocator([v for v, s in angle_ticks])
    tick_formatter1 = DictFormatter(dict(angle_ticks))

    grid_locator2 = MaxNLocator(2)

    grid_helper = floating_axes.GridHelperCurveLinear(
        tr, extremes=(.5*pi, 0, 2, 1),
        grid_locator1=grid_locator1,
        grid_locator2=grid_locator2,
        tick_formatter1=tick_formatter1,
        tick_formatter2=None)

    ax1 = fig.add_subplot(
        rect, axes_class=floating_axes.FloatingAxes, grid_helper=grid_helper)
    ax1.grid()

    # create a parasite axes whose transData in RA, cz
    aux_ax = ax1.get_aux_axes(tr)

    aux_ax.patch = ax1.patch  # for aux_ax to have a clip path as in ax
    ax1.patch.zorder = 0.9  # but this has a side effect that the patch is
    # drawn twice, and possibly over some other
    # artists. So, we decrease the zorder a bit to
    # prevent this.

    return ax1, aux_ax


def setup_axes3(fig, rect):
    """
    Sometimes, things like axis_direction need to be adjusted.
    """

    # rotate a bit for better orientation
    tr_rotate = Affine2D().translate(-95, 0)

    # scale degree to radians
    tr_scale = Affine2D().scale(np.pi/180., 1.)

    tr = tr_rotate + tr_scale + PolarAxes.PolarTransform()

    grid_locator1 = angle_helper.LocatorHMS(4)
    tick_formatter1 = angle_helper.FormatterHMS()

    grid_locator2 = MaxNLocator(3)

    # Specify theta limits in degrees
    ra0, ra1 = 8.*15, 14.*15
    # Specify radial limits
    cz0, cz1 = 0, 14000
    grid_helper = floating_axes.GridHelperCurveLinear(
        tr, extremes=(ra0, ra1, cz0, cz1),
        grid_locator1=grid_locator1,
        grid_locator2=grid_locator2,
        tick_formatter1=tick_formatter1,
        tick_formatter2=None)

    ax1 = fig.add_subplot(
        rect, axes_class=floating_axes.FloatingAxes, grid_helper=grid_helper)

    # adjust axis
    ax1.axis["left"].set_axis_direction("bottom")
    ax1.axis["right"].set_axis_direction("top")

    ax1.axis["bottom"].set_visible(False)
    ax1.axis["top"].set_axis_direction("bottom")
    ax1.axis["top"].toggle(ticklabels=True, label=True)
    ax1.axis["top"].major_ticklabels.set_axis_direction("top")
    ax1.axis["top"].label.set_axis_direction("top")

    ax1.axis["left"].label.set_text(r"cz [km$^{-1}$]")
    ax1.axis["top"].label.set_text(r"$\alpha_{1950}$")
    ax1.grid()

    # create a parasite axes whose transData in RA, cz
    aux_ax = ax1.get_aux_axes(tr)

    aux_ax.patch = ax1.patch  # for aux_ax to have a clip path as in ax
    ax1.patch.zorder = 0.9  # but this has a side effect that the patch is
    # drawn twice, and possibly over some other
    # artists. So, we decrease the zorder a bit to
    # prevent this.

    return ax1, aux_ax
fig = plt.figure(figsize=(8, 4))
fig.subplots_adjust(wspace=0.3, left=0.05, right=0.95)

ax1, aux_ax1 = setup_axes1(fig, 131)
aux_ax1.bar([0, 1, 2, 3], [3, 2, 1, 3])

ax2, aux_ax2 = setup_axes2(fig, 132)
theta = np.random.rand(10)*.5*np.pi
radius = np.random.rand(10) + 1.
aux_ax2.scatter(theta, radius)

ax3, aux_ax3 = setup_axes3(fig, 133)

theta = (8 + np.random.rand(10)*(14 - 8))*15.  # in degrees
radius = np.random.rand(10)*14000.
aux_ax3.scatter(theta, radius)

plt.show()