Notiz
Klicken Sie hier , um den vollständigen Beispielcode herunterzuladen
Datenbrowser #
Verbinden von Daten zwischen mehreren Leinwänden.
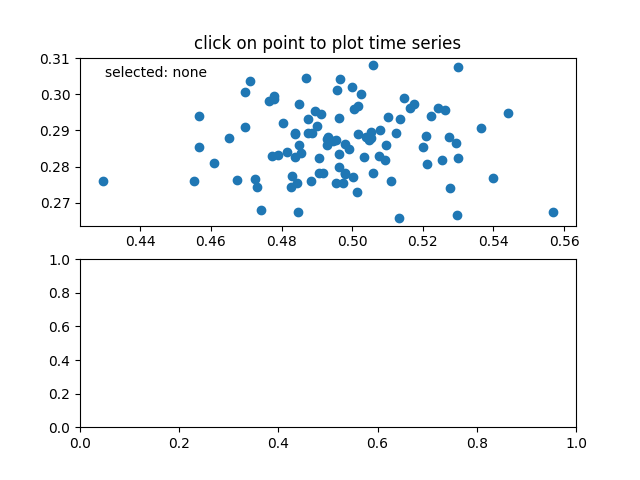
Dieses Beispiel behandelt die Interaktion von Daten mit mehreren Leinwänden. Dadurch können Sie einen Punkt auf einer Achse auswählen und hervorheben und die Daten dieses Punktes auf der anderen Achse generieren.
Notiz
Dieses Beispiel übt die interaktiven Fähigkeiten von Matplotlib aus und erscheint nicht in der statischen Dokumentation. Bitte führen Sie diesen Code auf Ihrem Computer aus, um die Interaktivität zu sehen.
Sie können einzelne Teile kopieren und einfügen oder das gesamte Beispiel über den Link unten auf der Seite herunterladen.

import numpy as np


class PointBrowser:
    """
    Click on a point to select and highlight it -- the data that
    generated the point will be shown in the lower axes.  Use the 'n'
    and 'p' keys to browse through the next and previous points
    """

    def __init__(self):
        self.lastind = 0

        self.text = ax.text(0.05, 0.95, 'selected: none',
                            transform=ax.transAxes, va='top')
        self.selected, = ax.plot([xs[0]], [ys[0]], 'o', ms=12, alpha=0.4,
                                 color='yellow', visible=False)

    def on_press(self, event):
        if self.lastind is None:
            return
        if event.key not in ('n', 'p'):
            return
        if event.key == 'n':
            inc = 1
        else:
            inc = -1

        self.lastind += inc
        self.lastind = np.clip(self.lastind, 0, len(xs) - 1)
        self.update()

    def on_pick(self, event):

        if event.artist != line:
            return True

        N = len(event.ind)
        if not N:
            return True

        # the click locations
        x = event.mouseevent.xdata
        y = event.mouseevent.ydata

        distances = np.hypot(x - xs[event.ind], y - ys[event.ind])
        indmin = distances.argmin()
        dataind = event.ind[indmin]

        self.lastind = dataind
        self.update()

    def update(self):
        if self.lastind is None:
            return

        dataind = self.lastind

        ax2.clear()
        ax2.plot(X[dataind])

        ax2.text(0.05, 0.9, f'mu={xs[dataind]:1.3f}\nsigma={ys[dataind]:1.3f}',
                 transform=ax2.transAxes, va='top')
        ax2.set_ylim(-0.5, 1.5)
        self.selected.set_visible(True)
        self.selected.set_data(xs[dataind], ys[dataind])

        self.text.set_text('selected: %d' % dataind)
        fig.canvas.draw()


if __name__ == '__main__':
    import matplotlib.pyplot as plt
    # Fixing random state for reproducibility
    np.random.seed(19680801)

    X = np.random.rand(100, 200)
    xs = np.mean(X, axis=1)
    ys = np.std(X, axis=1)

    fig, (ax, ax2) = plt.subplots(2, 1)
    ax.set_title('click on point to plot time series')
    line, = ax.plot(xs, ys, 'o', picker=True, pickradius=5)

    browser = PointBrowser()

    fig.canvas.mpl_connect('pick_event', browser.on_pick)
    fig.canvas.mpl_connect('key_press_event', browser.on_press)

    plt.show()